
When I first thought about how players would navigate and understand their power networks in Power Network Tycoon, I realized a traditional game map wouldn't cut it. What players really needed was a diagrammatic layout of their power network or as engineers call it a Single Line Diagram (SLD) that shows the simplified connection between assets.
This builds on my previous work with real-time graphs and data visualization and balancing complexity and clarity in the game's interface design.
The challenge was figuring out how to lay this out. Power networks can get incredibly complex, and I didn't want to overwhelm players with visual clutter while still showing enough detail to be useful for troubleshooting and optimisation.
Early Prototyping
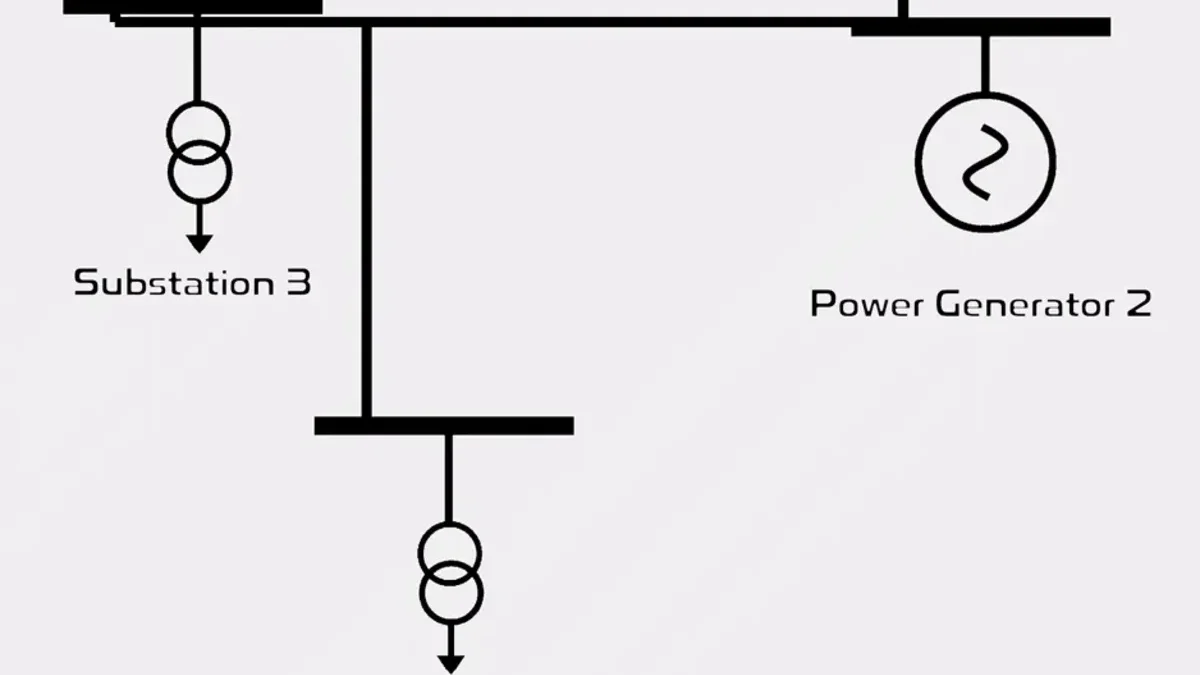
I started off with the most basic approach of drawing single line diagram symbols for generators, substations, poles, and conductors, then placing them on a canvas and connecting them with straight lines. It was a good proof of concept, but I quickly ran into problems.
The biggest issue was conductor routing. When drawing connections between busbars (the horizontal lines on top of generators and substations), the conductors needed visual "notches" which are small vertical segments that lift them up or down from the busbar edge. Without these, everything just blended together so you couldnt see where the busbar ended and when the conductor started. I struggled a lot with methods to prevent conductor paths from overlapping with other assets as well...
This led me down a rabbit hole of pathfinding algorithms. Simple methods like basic L-shaped routing work fine for small networks, but fail when assets are densely packed. That's where A* pathfinding cames i, which is an algorithm that finds the optimal path between two points while avoiding obstacles. In the SLD, A* allows conductors to intelligently detour around other assets, creating clean diagrams even in complex networks.
Asset Filtering and Placement
I found that when adding poles, they needed to be shown as nice junctions between conductor paths, but there were often too many. So I would only show a pole if it had 3 or more connection points, not the typical two. This reduced clutter but it was still a serious challenge getting conductor paths to not go over assets.
A direct (sloped) path would eliminate overlap issues, but it didn't look like the typical single line diagram an electrical engineer would expect. So L or Z shaped paths were enforced, using collision detection and orthogonal routing to ensure conductors bend at right angles and avoid other elements.
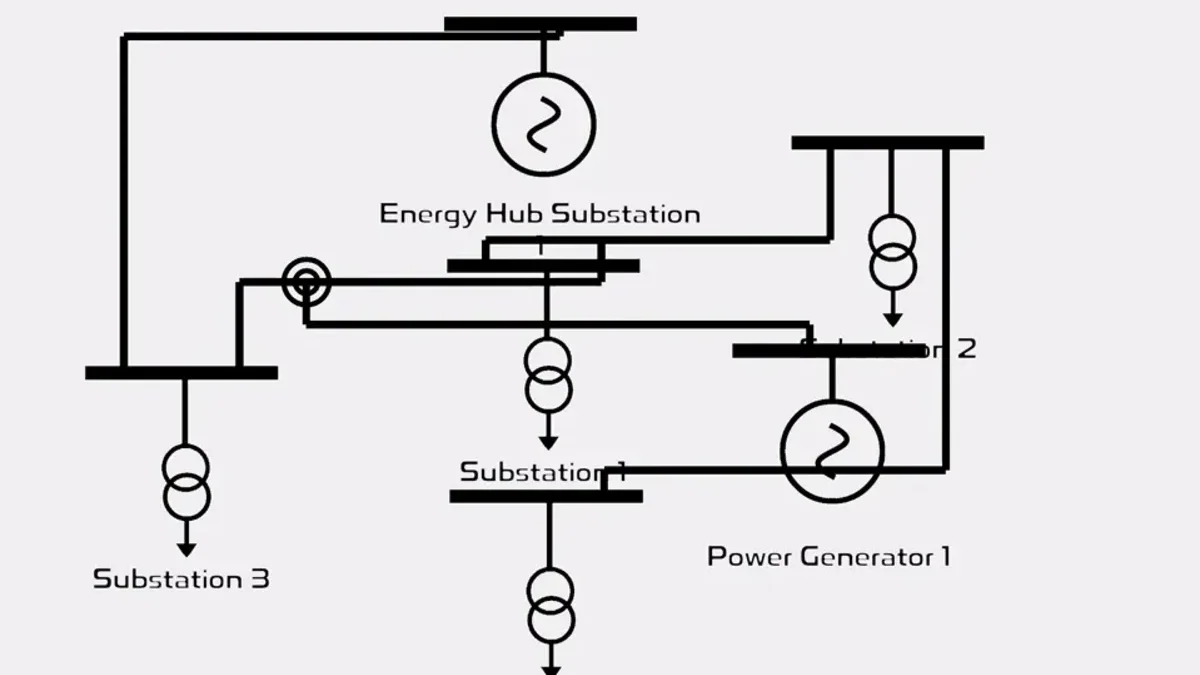
The placement of assets was also really challenging. For small grids, it didn't matter where I positioned assets, but when networks grew large, the best solution I found was roughly mapping world-placement to graph-placement. For example, assets on the west side of the map would appear more on the left side of the graph.
Scaling to Large Networks
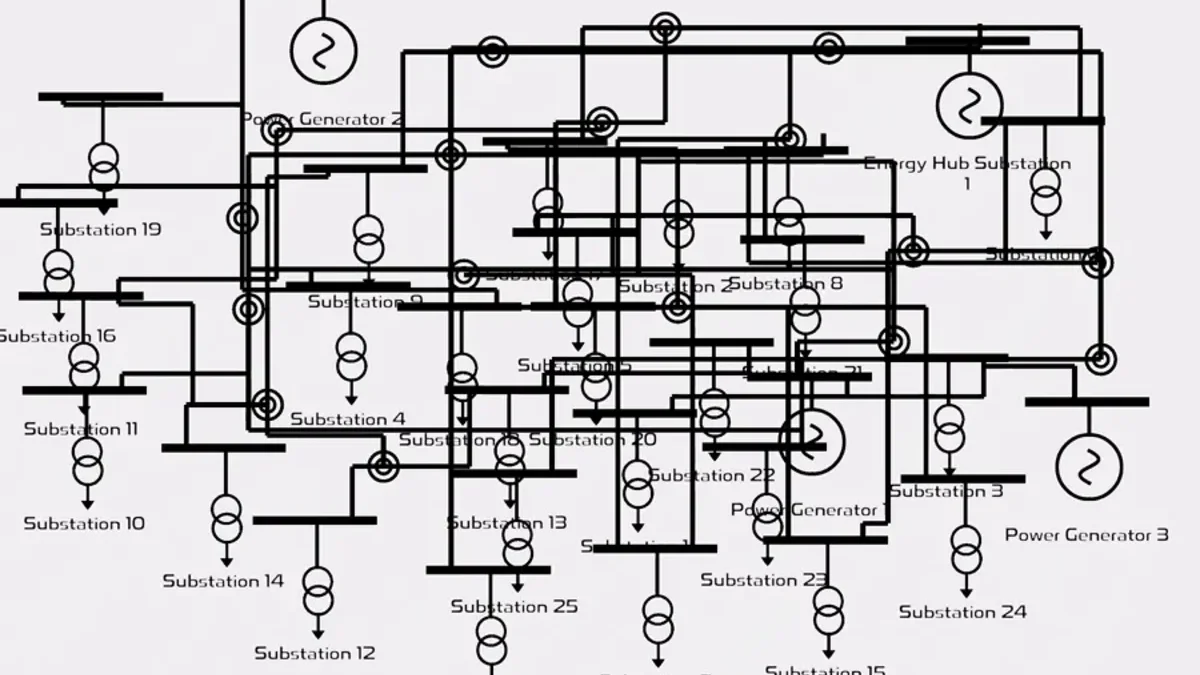
For huge networks, even with this placement matching, it resulted in a bit of a spaghetti drawing. I tried a few ways to neaten it up. One approach used colliders and a reverse big-bang arrangement (patent pending) where everything started really spread out in the graph, then iteratively stepped closer to each other until they reached a certain proximity. Groups that were close would move as a unit toward the center until everything eventually clustered together. This was computationally expensive though.
The current system uses a grid-based layout that's much more efficient. Assets are positioned on a regular grid pattern, starting from the center and working outward. This creates predictable "cable alleys" where conductor paths can run between grid-placed assets without conflicts. The grid system provides stable, deterministic layouts that minimize position changes when assets are added or removed.
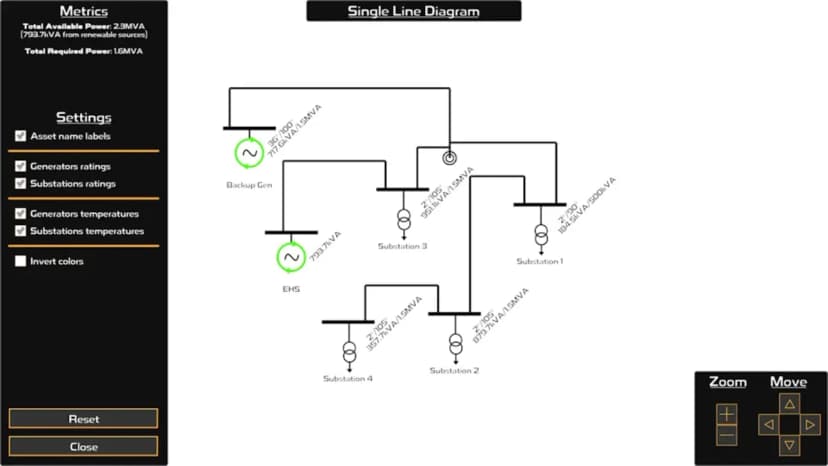
I also added semi-persistent placement for assets where you can drag and drop an asset and it will remember its position the next time the SLD opens, though this isn't saved to the main game file. For accessibility, I included toggles for labels and color inversion, giving it more of that SCADA/control center look. There are also animations and effects for active spinning generators that stand out with their green color.
The Final Result
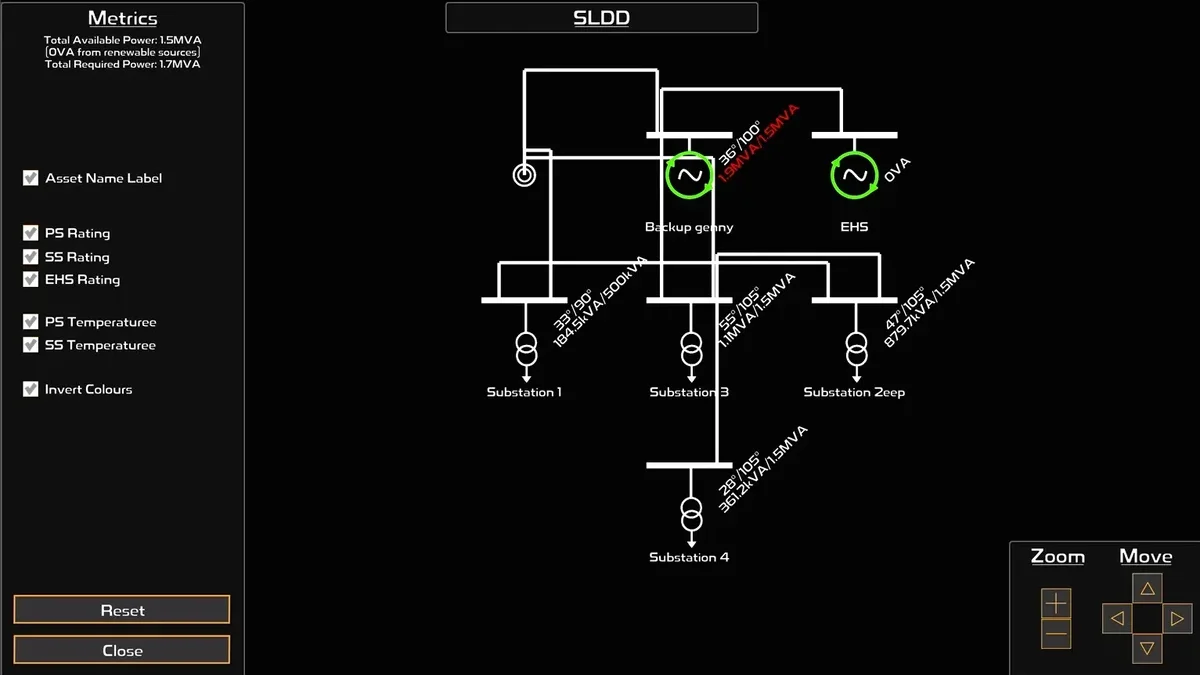
The final result is a customisable diagram of the network, allowing a view of the grid's key assets without too much clutter. It feels like a SCADA interface to some extent, so I've mapped opening the diagram with a button under the Condition Monitoring UI as well as mapping to the 'g' key (for Graph, though I'm running out of keys to map).

There are a few things I want to improve on in the future. It nicely shows yellow or red on text for high temperatures, but it doesn't show overheating conductors. I've had a million issues trying to get this to work. The challenges of consolidating long groups of conductors into a nice path and then making it able to go backward to see what individual conductors it represents and if any were overloaded, as well as remembering this for mouseover highlighting or color inversion, was beyond this first scope.
I've also been playing with capacitor banks lately and wondering if I should show them alongside substations on this screen. Is that useful? It's raised questions in my mind about whether my simplified implementation of capacitor banks would be confusing if shown here, and if the player gets anything meaningful out of it.
If you've tried the SLD, I'd love to hear what works well and what could be clearer. Does it help you understand and troubleshoot your networks better? Are there specific features or improvements you'd like to see? Let me know!
As always, thanks for playing and being part of the Power Network Tycoon community. I'm looking forward to hearing your feedback on this latest feature. I welcome you to try the game on Steam or itch.io.

